Application logs
Applications can contain bugs, that is no different with NoCode-X applications. Debugging is so much easier if you have some sort of log to keep track of events that happen in your application. The application logs of NoCode-X make it easy for you to debug your application.
There are 3 ways of accessing application logs.
All application logs
To access all application logs you can click the "bug" icon in the "Application wide tools"
A view containing all recent entries to the application log is opened:
![[Pasted image 20241127151042.png]]
Filtering logs
You can filter log by using the filters on the top of the screen:
- Level: Filters the logs on severity level by which they were created. (Error, Debug, Warn, Info, Trace)
- From / To: Filters the logs by matching the time they were logged with a given date time range.
- Template: Filters the logs that were triggered from a certain template.
- Action: Filters the logs that were triggered from a certain action.
You can refresh according to your new filters by hitting "Refresh logs" or choose to stream logs by hitting "Stream logs".
Log line format
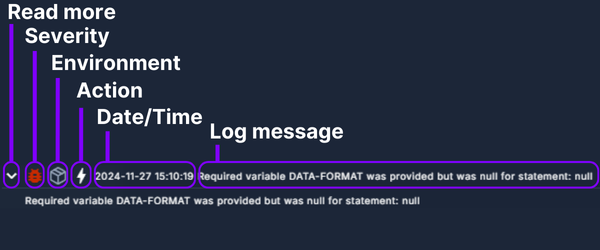
A log line follows a certain pattern:

- Read more: Sometimes a logline is too long to display on one line, click this button to view the entire log entry.
- Severity: The severity by which this log line was logged.
- Environment: The DTAP environment on which this log line was logged.
- Action: The action responsible for logging this log line.
- Date/Time: The exact time this log line was logged.
- Log message: The actual log message.
Logs of an action
Recent logs can be viewed inside the [Action editor](../../nocode-x-platform/Action editor) as well. This comes in handy when you want to know which Function instance is responsible for a certain error.

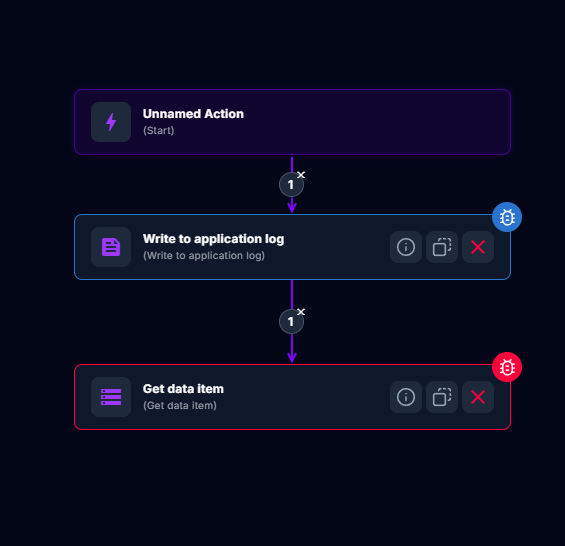
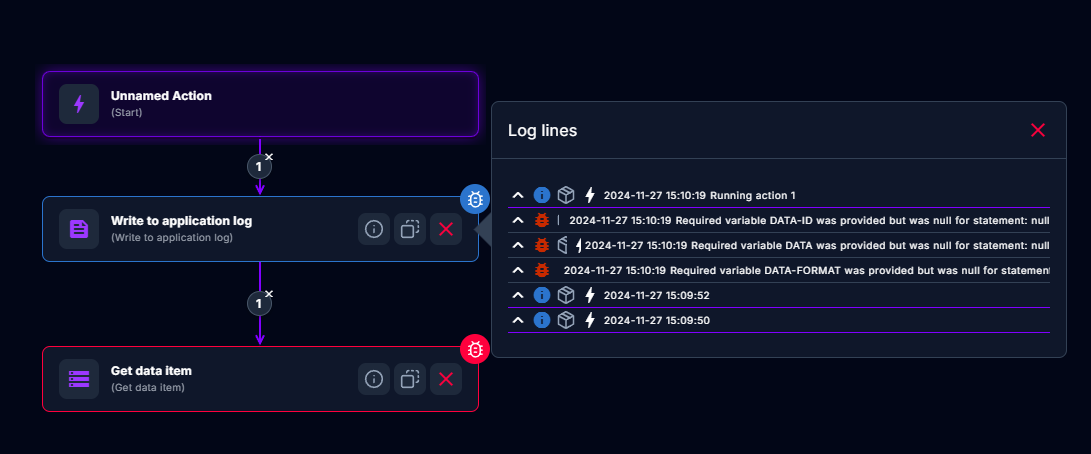
Function instances that have a colored border are responsible for logging log lines. The color of the border indicates the severity of the log lines being written to the log. By clicking on the "Bug" icon in the top right corner of the Function instance you can view the actual logs:

This shows all the logs written by the action but indicates the ones written by this particular Function instance with a purple line.
Logs of a test run
These can be accessed after executing test through the test page as described in Testing
Manually writing entries in the logs
Writing logs manually can be done by using the function "Write to application log"